코드 1. csv 파일 읽어서 캔들 챠트 그리기
csv 파일 형식 . 아래와 같은 형식으로 데이터 수집하는 방법 : https://igotit.tistory.com/5766 의 코드 4.

위 형식의csv 파일을 읽어서 캔들 챠트 표현하는 코드.
This file contains bidirectional Unicode text that may be interpreted or compiled differently than what appears below. To review, open the file in an editor that reveals hidden Unicode characters.
Learn more about bidirectional Unicode characters
| import pandas as pd | |
| import plotly.graph_objects as go | |
| # CSV 파일명 지정 | |
| csv_file = 'bybit_linear_usdt_candle_m1_2024-08-01_2024-08-24.csv' | |
| # CSV 파일 읽기 | |
| df = pd.read_csv(csv_file) | |
| # 캔들 차트 생성 | |
| fig = go.Figure(data=[go.Candlestick(x=df['timestamp'], | |
| open=df['open'], | |
| high=df['high'], | |
| low=df['low'], | |
| close=df['close'])]) | |
| # 타임스탬프를 datetime 형식으로 변환 (optional) | |
| df['timestamp'] = pd.to_datetime(df['timestamp'], unit='ms') | |
| # 캔들 차트 생성 | |
| fig = go.Figure(data=[go.Candlestick(x=df['timestamp'], | |
| open=df['open'], | |
| high=df['high'], | |
| low=df['low'], | |
| close=df['close'])]) | |
| # 차트 레이아웃 설정 | |
| fig.update_layout( | |
| title=f'Candlestick Chart for BTCUSDT', | |
| xaxis_title='Date', | |
| yaxis_title='Price', | |
| xaxis_rangeslider_visible=False | |
| ) | |
| # 차트 출력 | |
| fig.show() |
코드 설명:
- CSV 파일 읽기:
- csv_file에 파일명을 지정하고, pd.read_csv(csv_file)로 CSV 파일을 읽어 df 데이터프레임에 저장.
- 타임스탬프 변환:
- df['timestamp'] = pd.to_datetime(df['timestamp'], unit='ms')로 밀리초 단위 타임스탬프를 datetime 형식으로 변환.
- 캔들 차트 생성:
- go.Figure와 go.Candlestick로 캔들 차트를 생성.
- x축에 timestamp, open, high, low, close를 설정.
- 차트 레이아웃 설정:
- fig.update_layout로 차트 제목, X축과 Y축 제목, 범위 슬라이더 숨김 설정.
- 차트 출력:
- fig.show()로 브라우저에서 차트를 보여줌.
위 코드 실행하면 웹브라우저 실행되면서 챠트 표현된다.
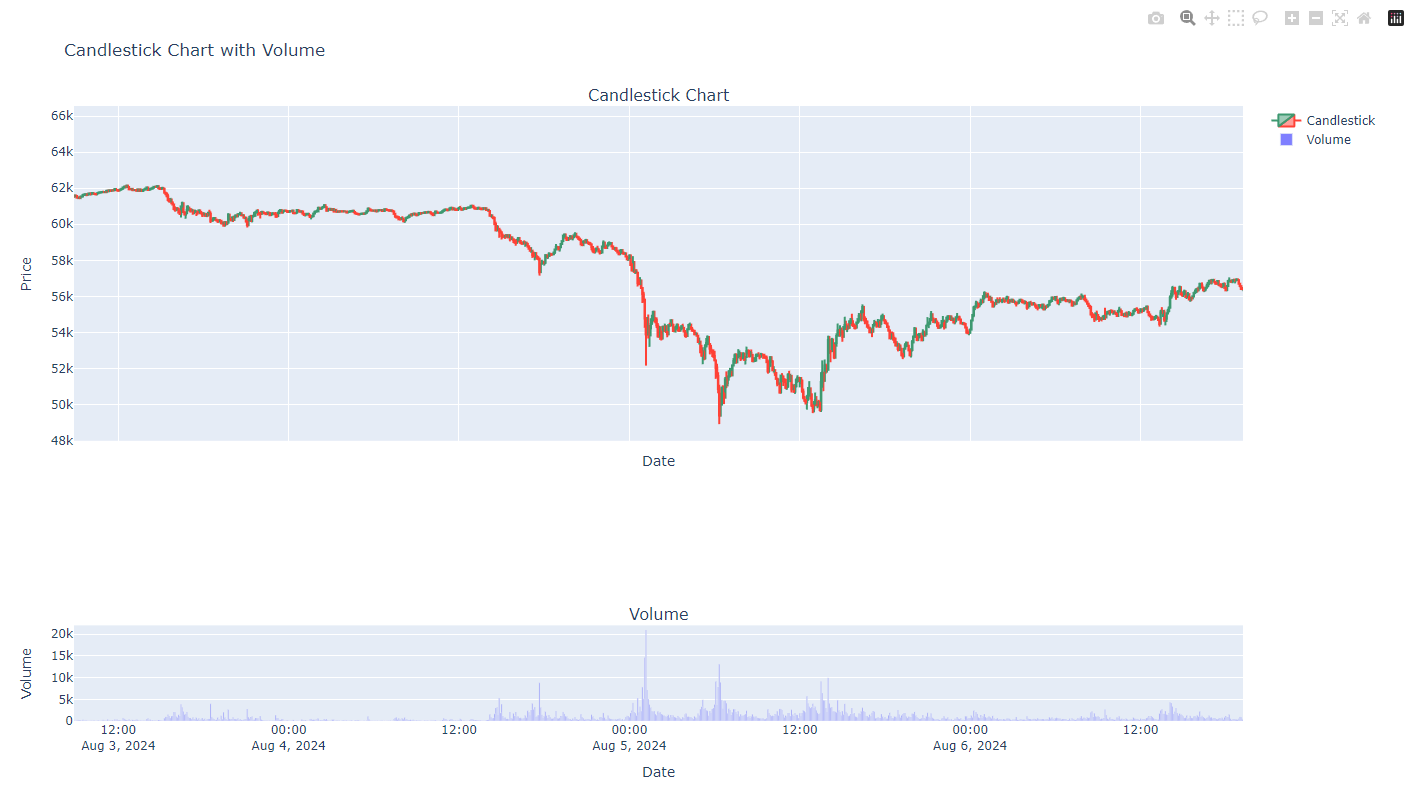
코드 2. 거래량 표현 추가
- 위 코드는 캔들의 가격만 표현한 것인데 아래 코드는 거래량 챠트 추가한것.
This file contains bidirectional Unicode text that may be interpreted or compiled differently than what appears below. To review, open the file in an editor that reveals hidden Unicode characters.
Learn more about bidirectional Unicode characters
| import pandas as pd | |
| import plotly.graph_objects as go | |
| from plotly.subplots import make_subplots | |
| # CSV 파일명 | |
| csv_file = 'bybit_linear_usdt_candle_m1_2024-08-01_2024-08-24.csv' | |
| # CSV 파일 읽기 | |
| df = pd.read_csv(csv_file) | |
| # 밀리초 단위 타임스탬프를 datetime 형식으로 변환 | |
| df['timestamp'] = pd.to_datetime(df['timestamp'], unit='ms') | |
| # 서브플롯 생성 (2개의 서브플롯: 캔들 차트와 거래량 차트) | |
| fig = make_subplots(rows=2, cols=1, shared_xaxes=True, | |
| vertical_spacing=0.3, | |
| subplot_titles=('Candlestick Chart', 'Volume'), | |
| row_width=[0.2, 0.7]) # 비율을 조정 | |
| # 캔들 차트 추가 | |
| fig.add_trace(go.Candlestick( | |
| x=df['timestamp'], # X축: 시간 | |
| open=df['open'], # 시가 | |
| high=df['high'], # 고가 | |
| low=df['low'], # 저가 | |
| close=df['close'], # 종가 | |
| name='Candlestick' | |
| ), row=1, col=1) | |
| # 거래량 차트 추가 | |
| fig.add_trace(go.Bar( | |
| x=df['timestamp'], # X축: 시간 | |
| y=df['volume'], # 거래량 | |
| name='Volume', | |
| marker_color='rgba(0, 0, 255, 0.5)' # 색상 및 투명도 조정 | |
| ), row=2, col=1) | |
| # 레이아웃 설정 | |
| fig.update_layout( | |
| title='Candlestick Chart with Volume', # 차트 제목 | |
| xaxis_title='Date', # X축 제목 | |
| yaxis_title='Price', # Y축 제목 (캔들 차트) | |
| xaxis2_title='Date', # X축 제목 (거래량 차트) | |
| yaxis2_title='Volume', # Y축 제목 (거래량 차트) | |
| xaxis_rangeslider_visible=False # 범위 슬라이더 숨기기 | |
| ) | |
| # 차트 출력 | |
| fig.show() |
코드 설명:
- CSV 파일 읽기:
- csv_file에 파일명을 지정하고, pd.read_csv(csv_file)로 CSV 파일을 읽어 df 데이터프레임에 저장.
- 타임스탬프 변환:
- df['timestamp'] = pd.to_datetime(df['timestamp'], unit='ms')로 밀리초 단위 타임스탬프를 datetime 형식으로 변환.
- 서브플롯 생성:
- make_subplots를 사용해 두 개의 서브플롯을 생성. 첫 번째는 캔들 차트, 두 번째는 거래량 차트.
- 캔들 차트 추가:
- go.Candlestick을 사용해 첫 번째 서브플롯에 캔들 차트를 추가.
- 거래량 차트 추가:
- go.Bar를 사용해 두 번째 서브플롯에 거래량 차트를 추가. 색상과 투명도를 조절.
- 레이아웃 설정:
- fig.update_layout로 차트 제목, X축과 Y축 제목을 설정.
- 범위 슬라이더는 숨김.
- 차트 출력:
- fig.show()로 브라우저에서 차트를 표시.
실행결과
연관
파이썬에서 암호화폐 캔들 데이터 확보방법 상세
pybit . 암호화폐 캔들 백데이터 처리 . 파이썬
개요 암호화폐 거래소 바이비트 API 통신 위한 공식 파이썬 패키지 pybit 이용하여 파이썬에서 캔들 데이터 확보하기 위한 가장 기본적인 형태에서 출발하여 점진적으로 더 유용한 형식으로 코
igotit.tistory.com
첫 등록 : 2024.08.23
최종 수정 :
단축 주소 : https://igotit.tistory.com/5771
'지속가능티끌 > Python' 카테고리의 다른 글
| plotly . 다이아그램 그리기 (0) | 2024.08.24 |
|---|---|
| Python . Pandas DataFrame 클래스 (0) | 2024.08.22 |
| chatGPT 에 코딩 해달라고 해봤다. (0) | 2024.08.17 |
| 파이썬 포터블 개발환경 구축 - 설치 방식. (0) | 2024.08.16 |
| Python . 포터블 개발환경 구축 (0) | 2024.08.16 |


)

댓글