Pyplot
사용예.
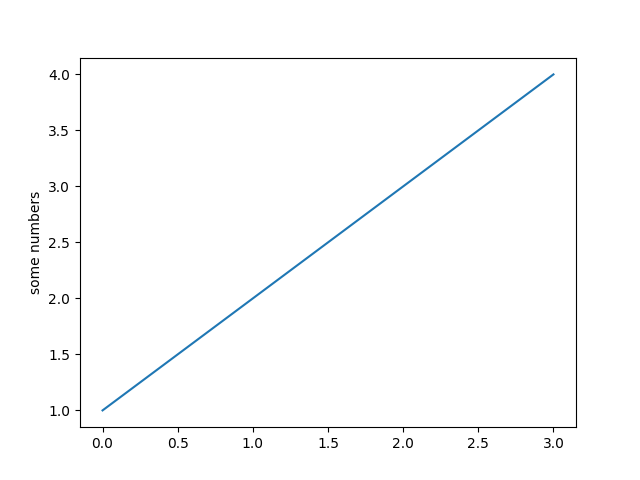
import matplotlib.pyplot as plt
plt.plot([1, 2, 3, 4])
plt.ylabel('some numbers')
plt.show()
결과

Pyplot상세 설명 사이트 : https://matplotlib.org/tutorials/introductory/pyplot.html
Pyplot tutorial — Matplotlib 3.0.3 documentation
The text() command can be used to add text in an arbitrary location, and the xlabel(), ylabel() and title() are used to add text in the indicated locations (see Text in Matplotlib Plots for a more detailed example) All of the text() commands return an matp
matplotlib.org
첫등록 : 2019년 4월 21일
최종수정 :
본 글 단축주소 : https://igotit.tistory.com/2126
'지속가능티끌 > Python' 카테고리의 다른 글
| Python. function, 함수 (0) | 2019.05.16 |
|---|---|
| Python. tuple (0) | 2019.04.21 |
| Python. for in (0) | 2019.04.21 |
| Visual Studio 2019. 파이썬 개발환경 구축 (0) | 2019.04.18 |
| Python. ctypes. 파이썬에서 DLL 활용 (0) | 2019.04.11 |


댓글